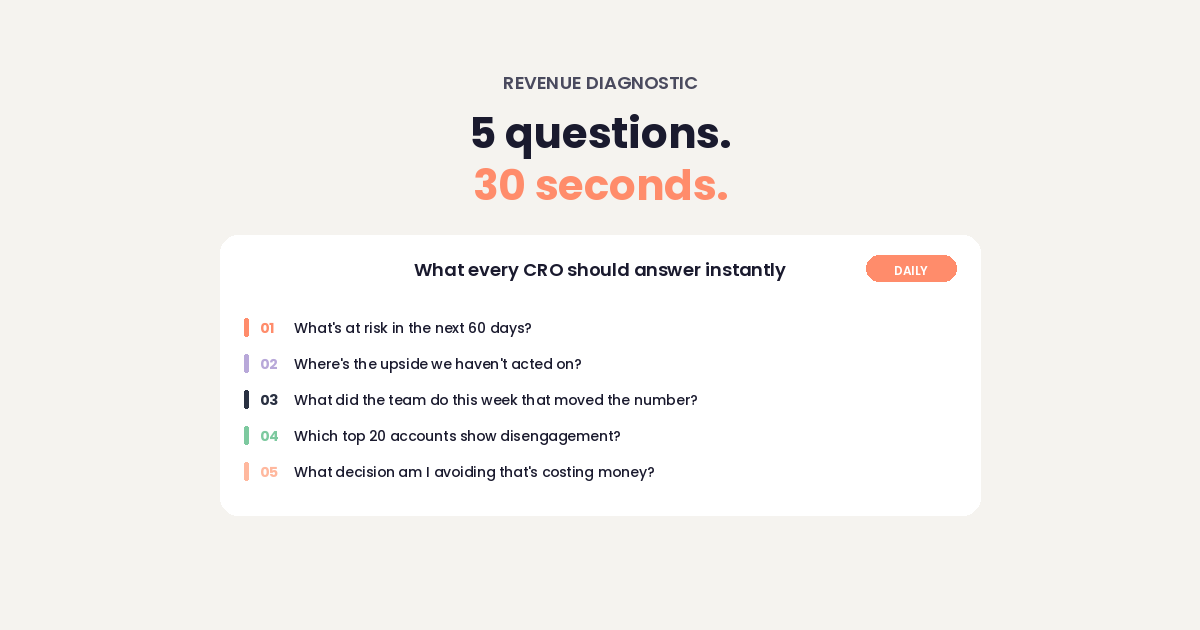
The 5 CRO revenue diagnostic questions every Chief Revenue Officer should answer instantly. A sharper alternative to dashboards and quarterly reviews.
The 5 CRO revenue diagnostic questions every Chief Revenue Officer should answer instantly. A sharper alternative to dashboards and quarterly reviews.

A practical VP of ticketing 90 day plan for sports and live entertainment leaders. What to audit, diagnose, and decide before your first quarterly review.
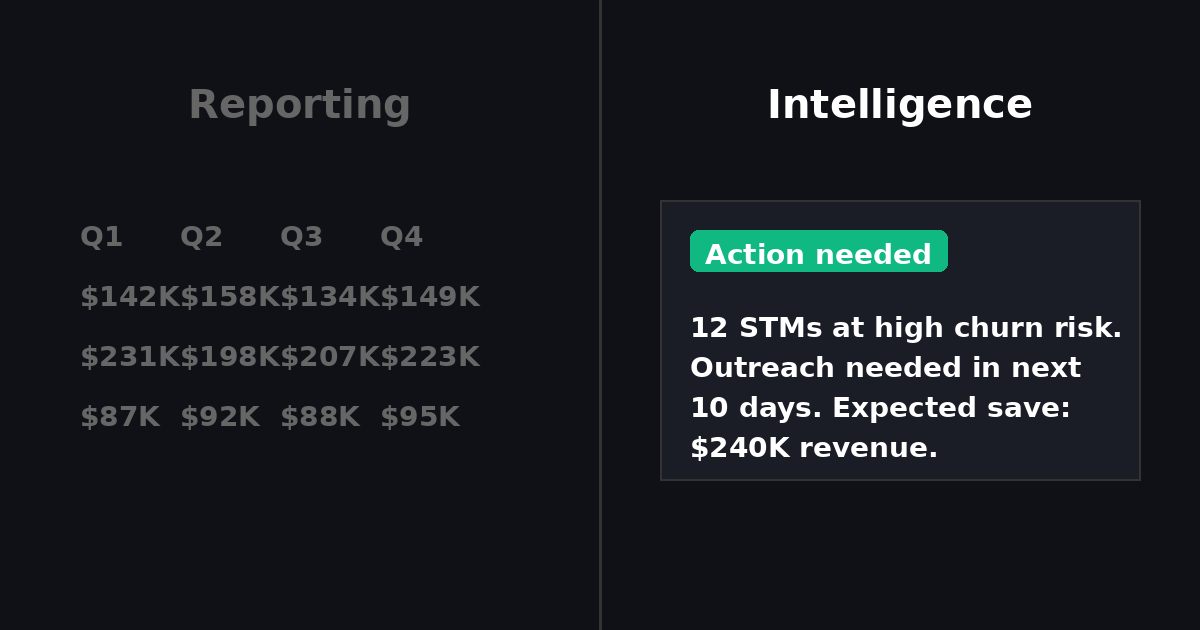
Revenue intelligence isn't analytics. It's the difference between knowing what happened and knowing exactly what to do next. Here's why that matters for sports revenue teams.
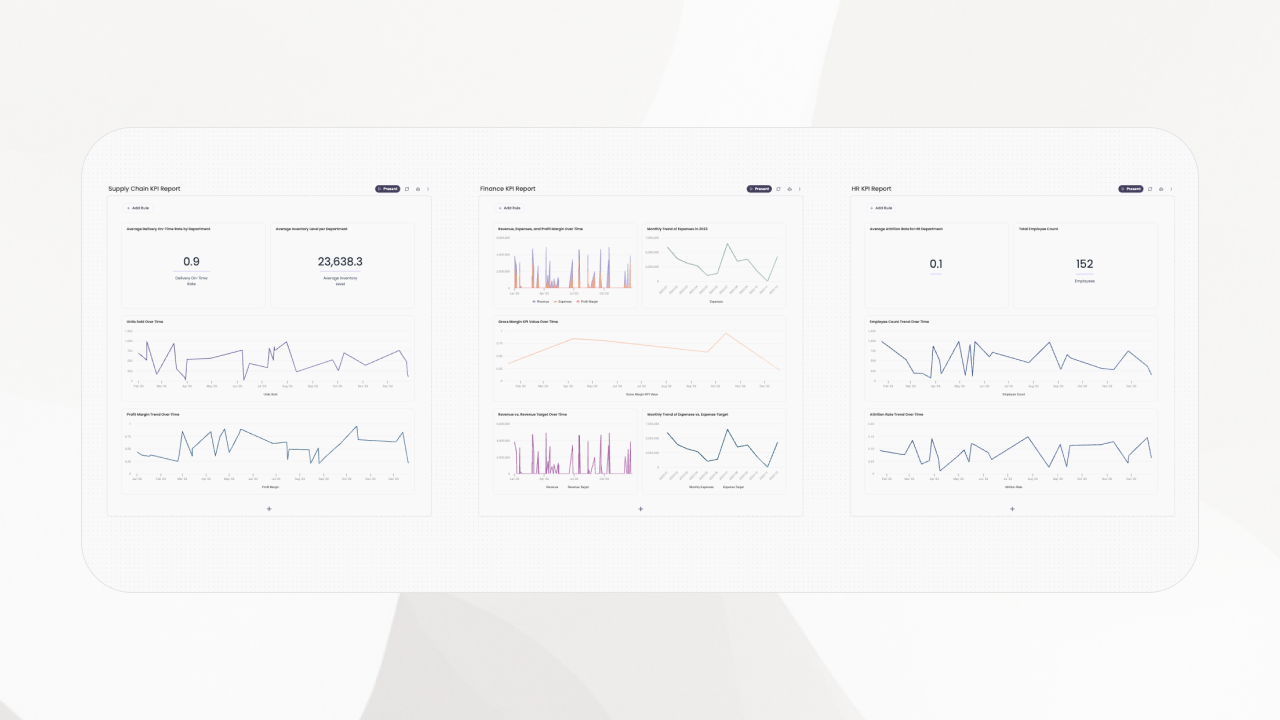
I share how I use KPI reporting to guide decisions, with uses, pros and cons, AI impact, dashboards versus reports, a creation framework, and templates.
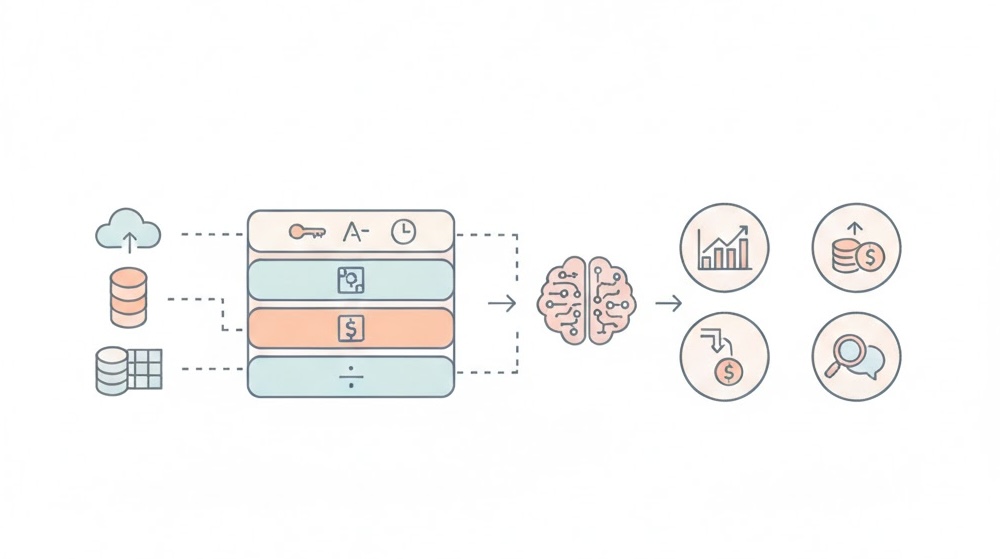
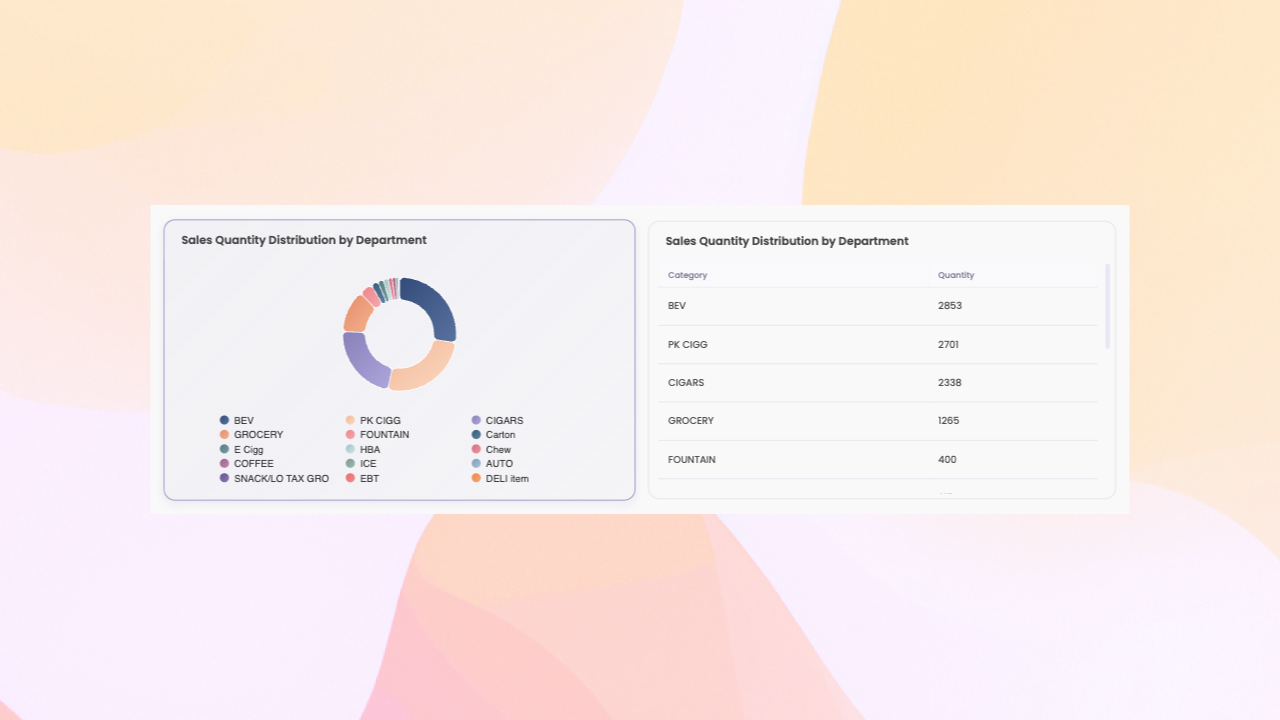
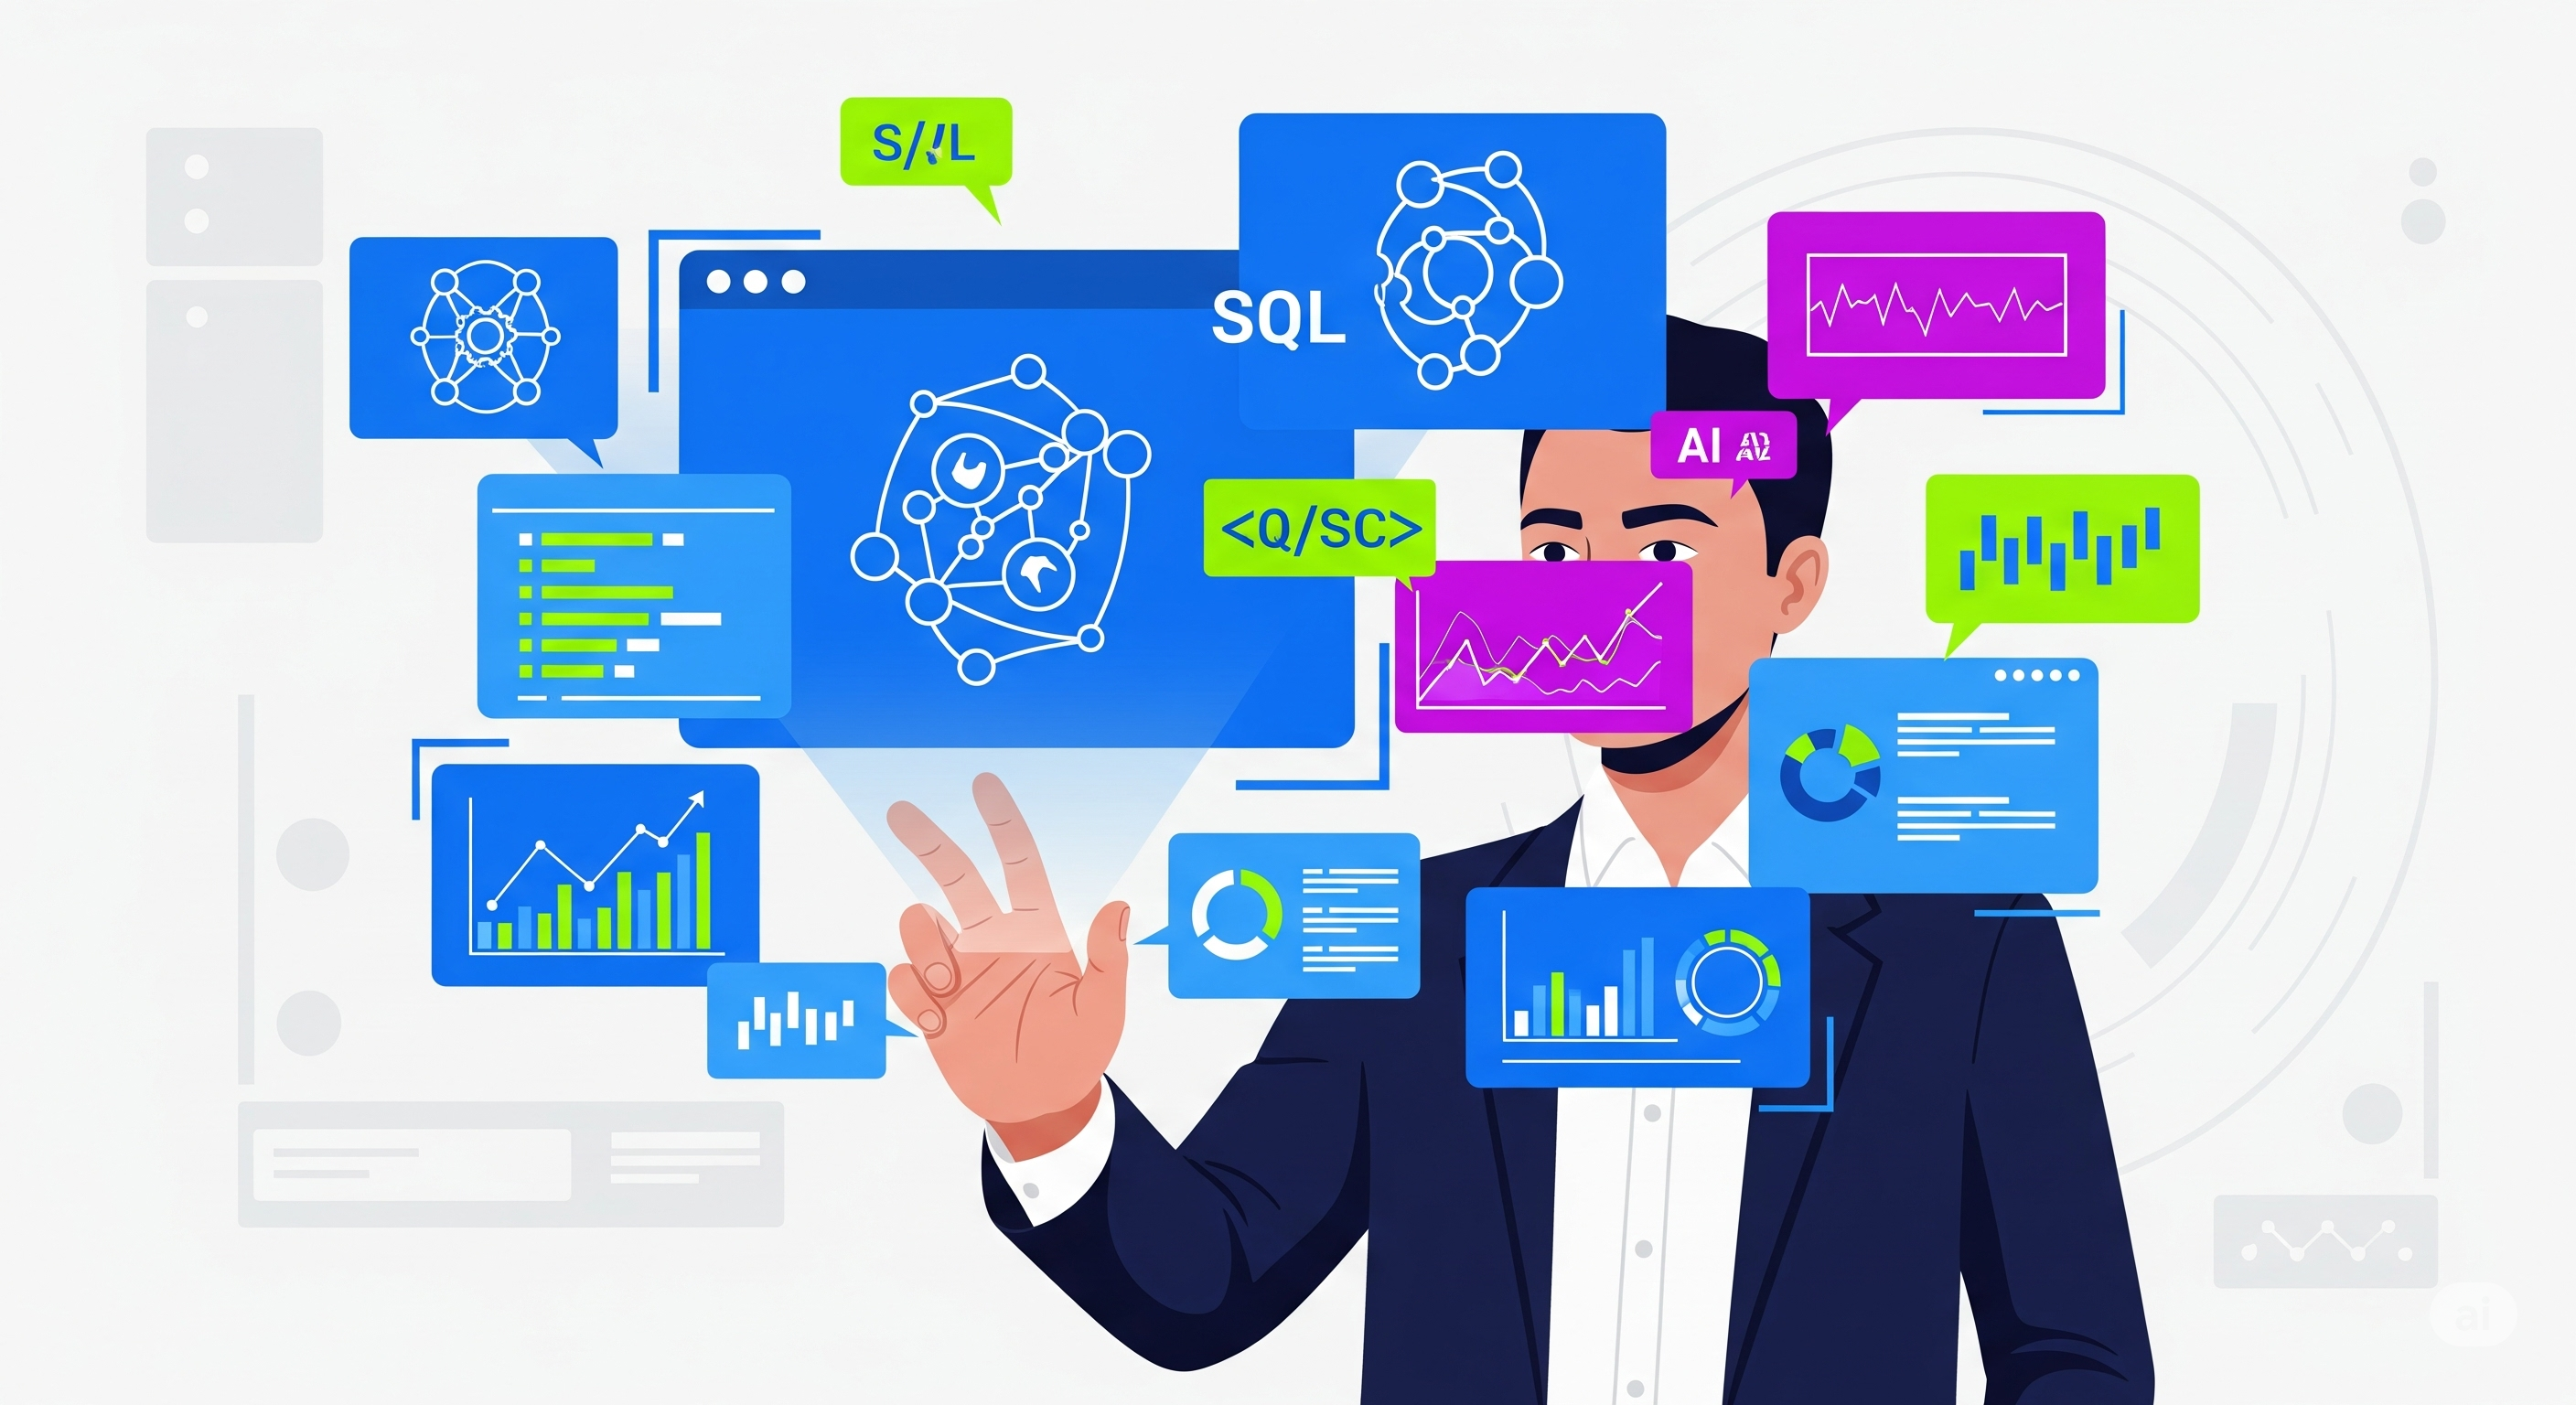
Master data preparation for AI agents and agentic reporting. Learn data standardization, business context definition, and best practices to enable AI-powered reporting agents to deliver trustworthy insights without expensive data warehouses.
How I use pivot tables for exploration and pivot charts for communication—when to choose each and how they work together.
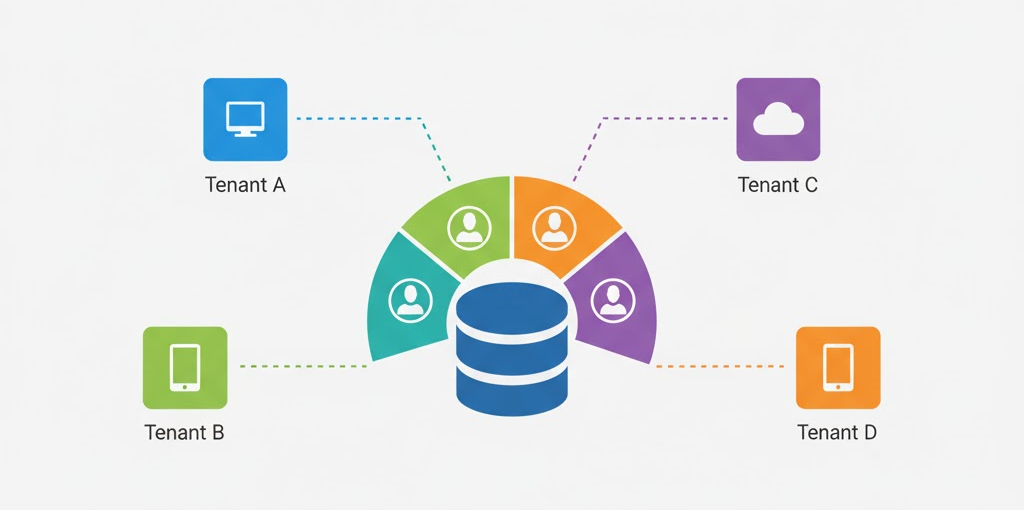
Learn how to design secure and scalable multi-tenant databases for AI-powered analytics and reporting. Explore segmentation strategies, tenant isolation, and row-level security.
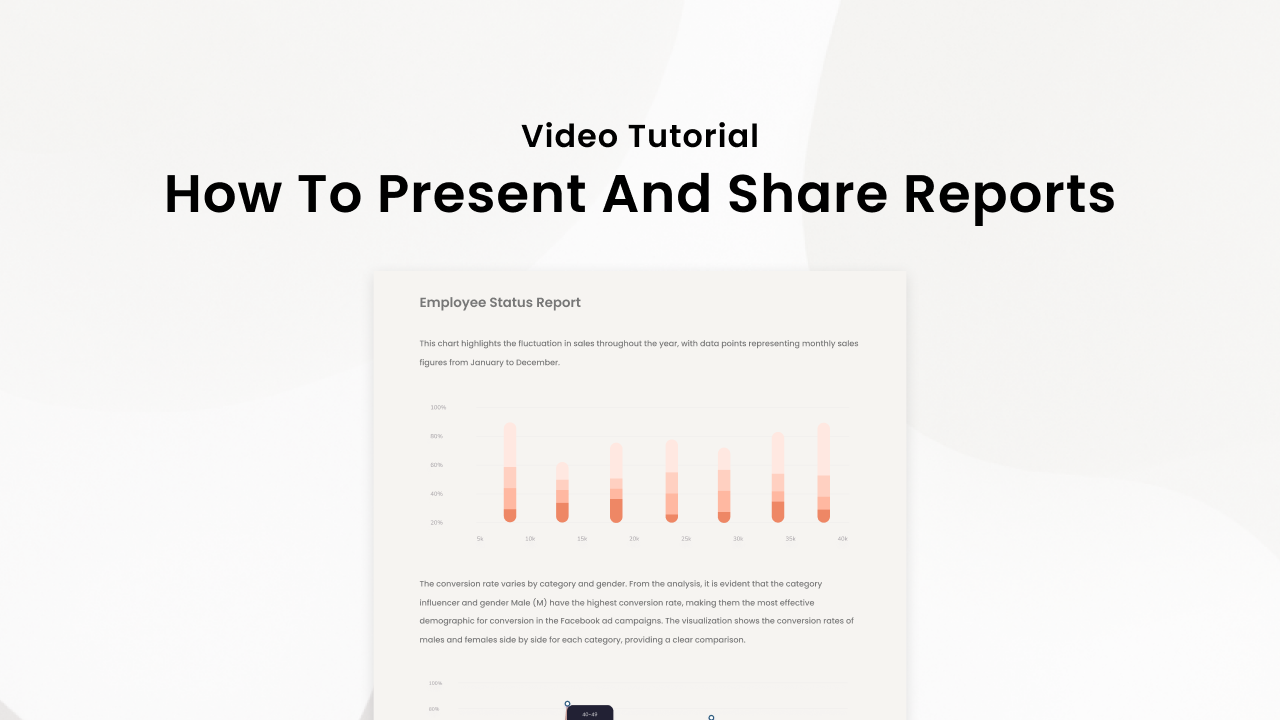
Learn how to transform your data insights into compelling, interactive stories with Breadcrumb's presentation and sharing features. Master the art of report storytelling with our comprehensive tutorial.
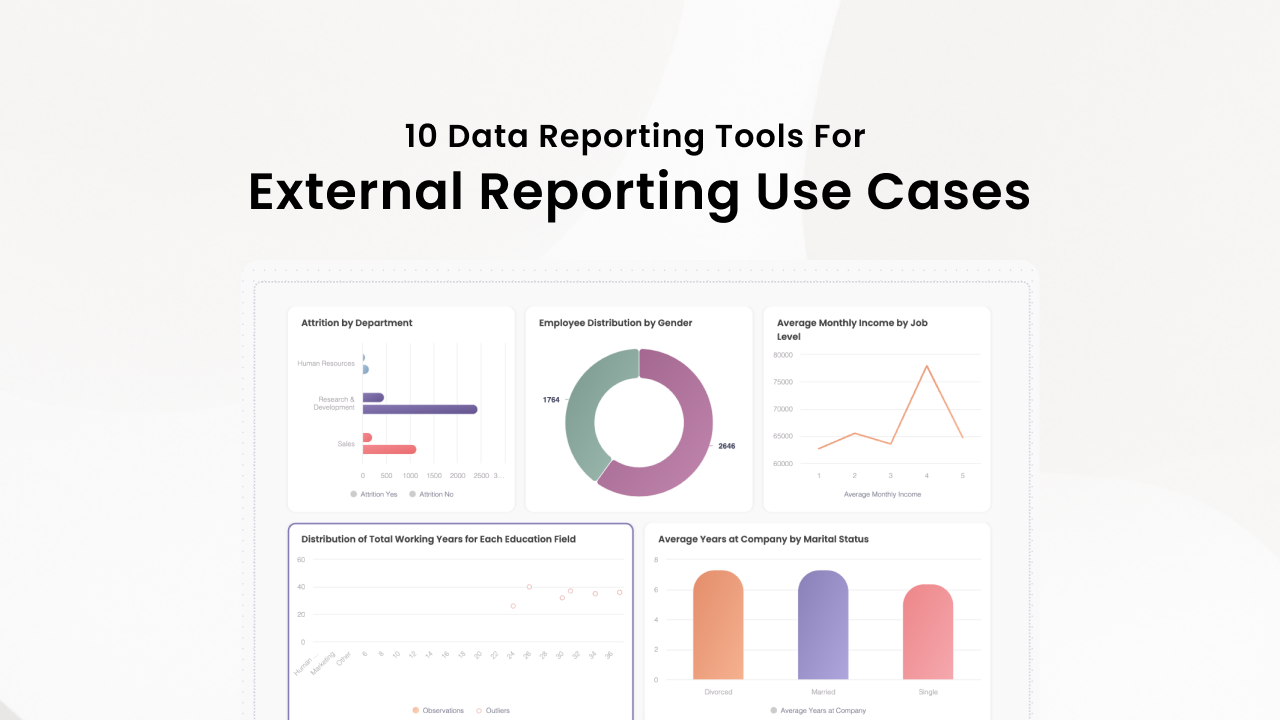
Discover the best data reporting tools for sharing analytics with clients, stakeholders, and partners. Compare traditional BI platforms with modern AI-powered solutions for external reporting needs.
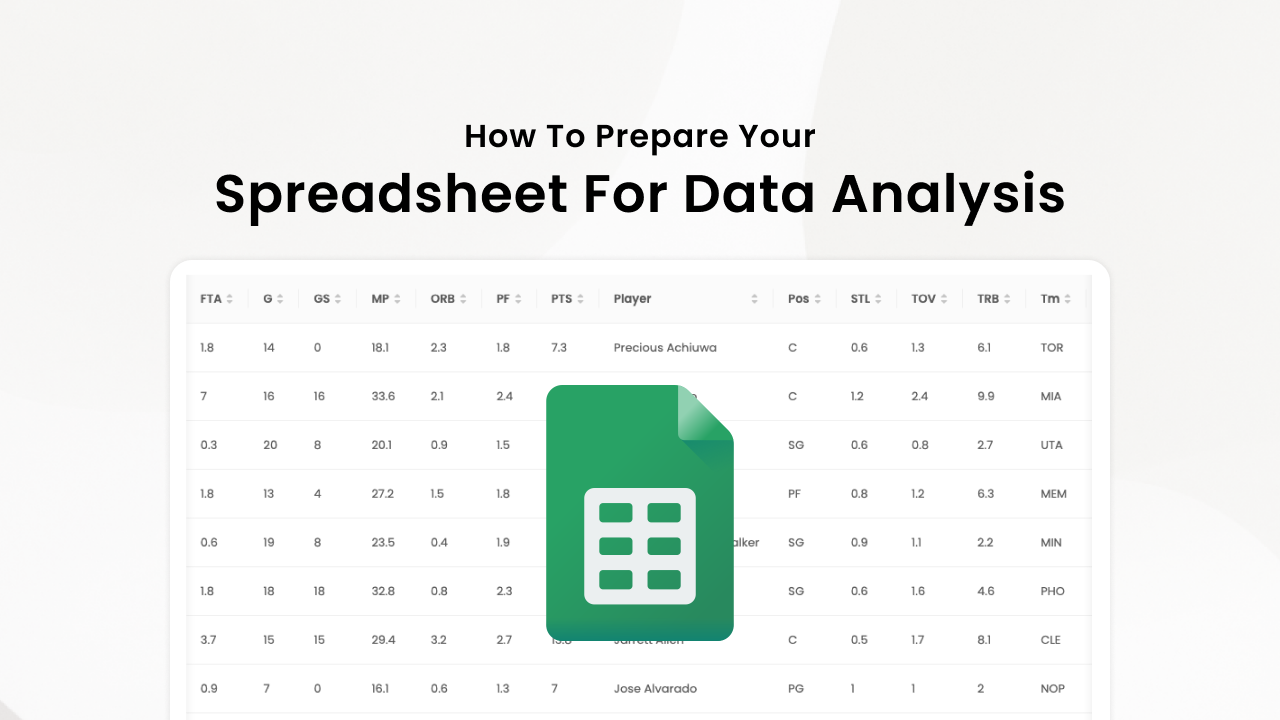
Learn what raw data table format means, why it's crucial for spreadsheet uploads, and how AI-powered tools like Breadcrumb automatically clean your data for better analytics.

Looking for a Tableau alternative that is faster, easier, and built for non-technical teams? Discover why AI-powered tools like Breadcrumb are replacing static dashboards with dynamic, shareable insights.

Discover how modern AI reporting tools eliminate the need for coding skills or complex training. Learn how anyone can start analyzing data and creating reports in minutes using conversational AI interfaces.
Discover the must-have AI tools that are transforming how data consultants work. From automated analysis to intelligent reporting, learn which tools will give you a competitive edge and help you deliver better client value.
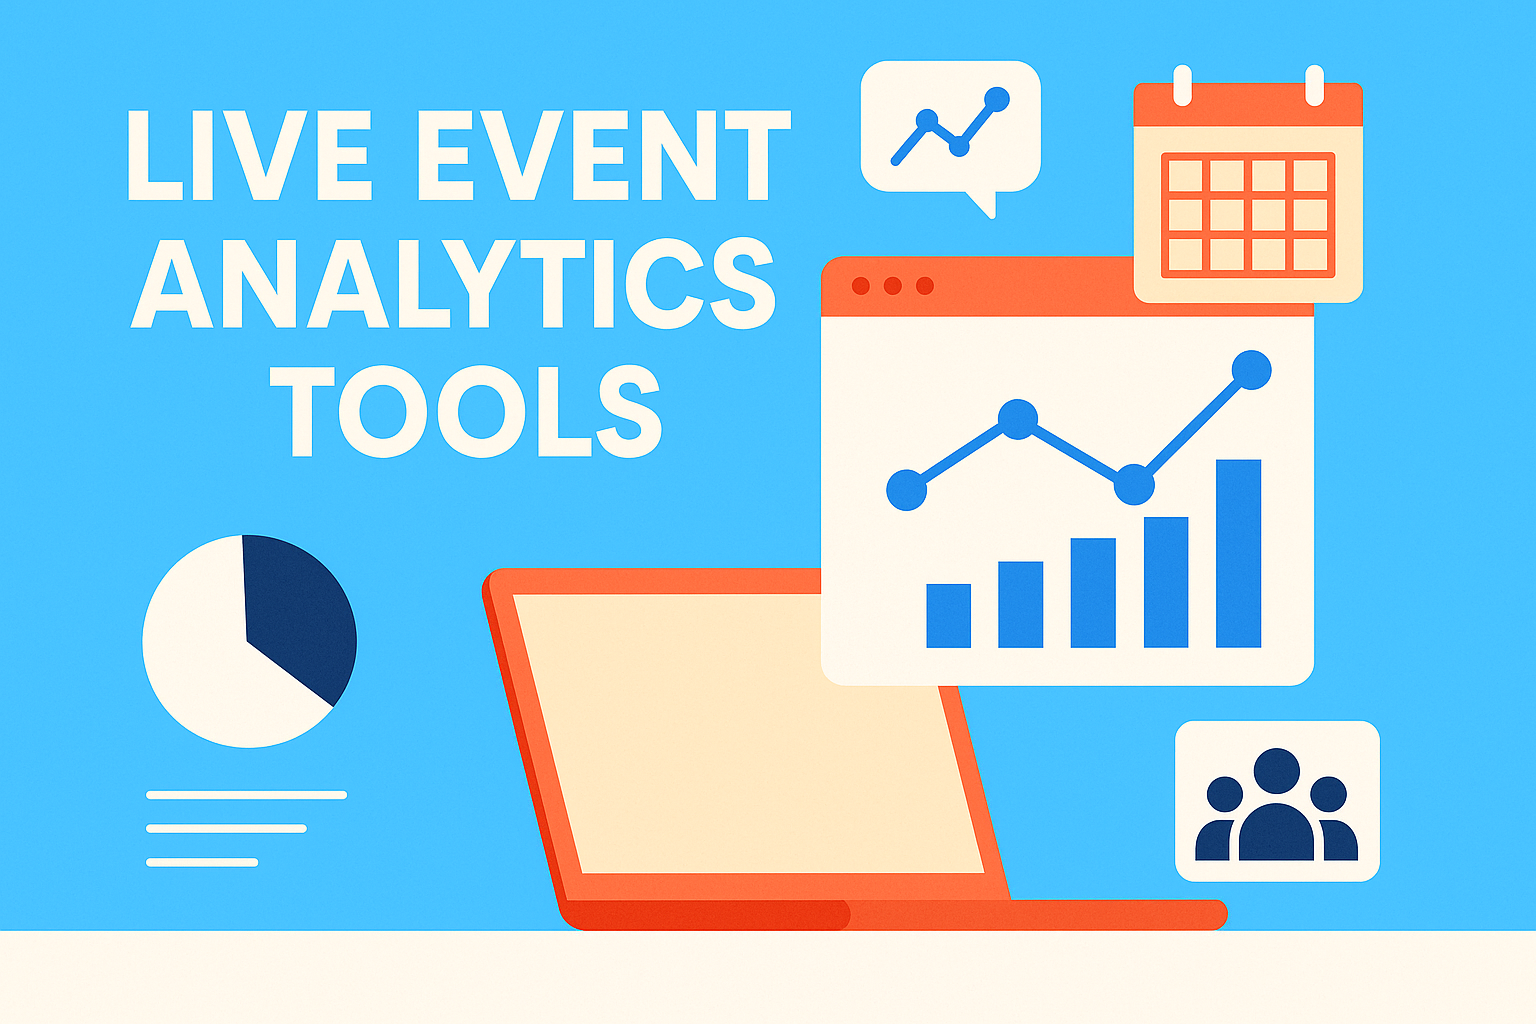
Explore the evolving landscape of data analytics in live events, from traditional tools to AI-powered solutions. Discover how modern analytics are transforming event management, attendee engagement, and ROI measurement.

Discover 20 essential statistics about live events and stadiums in 2025. Learn why real-time analytics and smart tracking tools are critical and why it's time to adopt agentic reporting.
Is your team drowning in data requests while critical insights sit buried in spreadsheets? Discover the five telltale signs that indicate your organization is ready for agentic reporting—and how it can transform your data operations.

Discover why traditional BI tools like Tableau and Power BI fall short for relationship-driven customer reporting, and how modern AI-powered analytics can transform your customer insights.

Discover how AI-powered analytics can help you unlock hidden patterns in your Google Analytics data. Get instant insights, automate reporting, and make data-driven decisions faster.

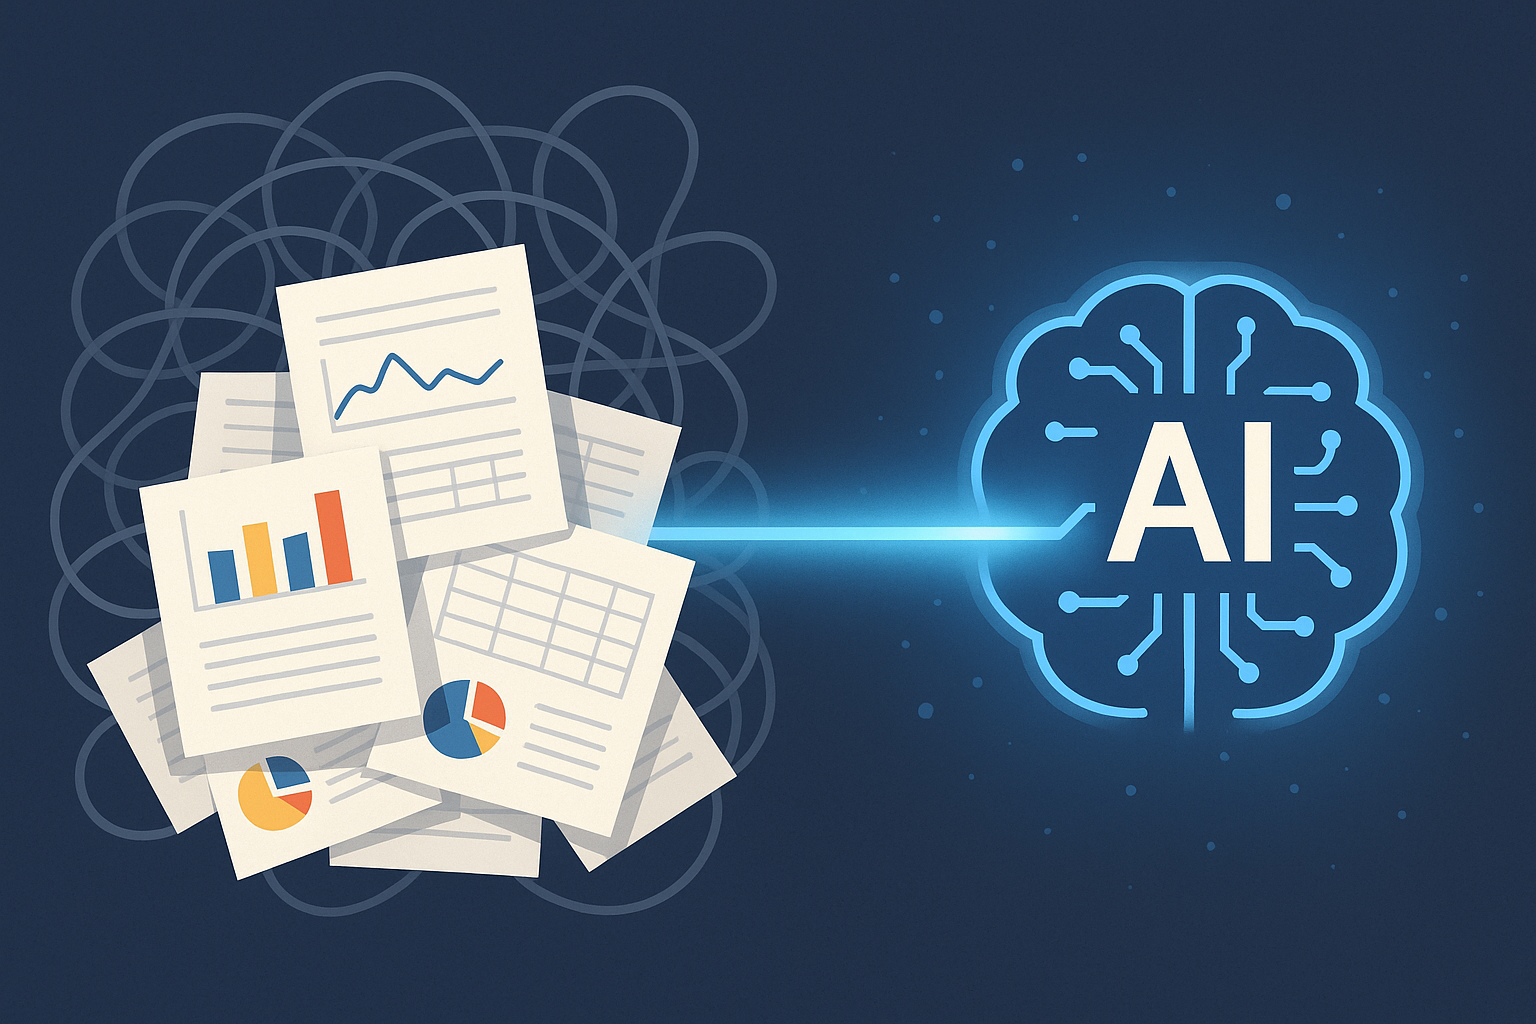
Learn how to transform raw event data into actionable insights using AI tools. Discover strategies for unlocking value from your event analytics to drive better decisions and prove ROI.
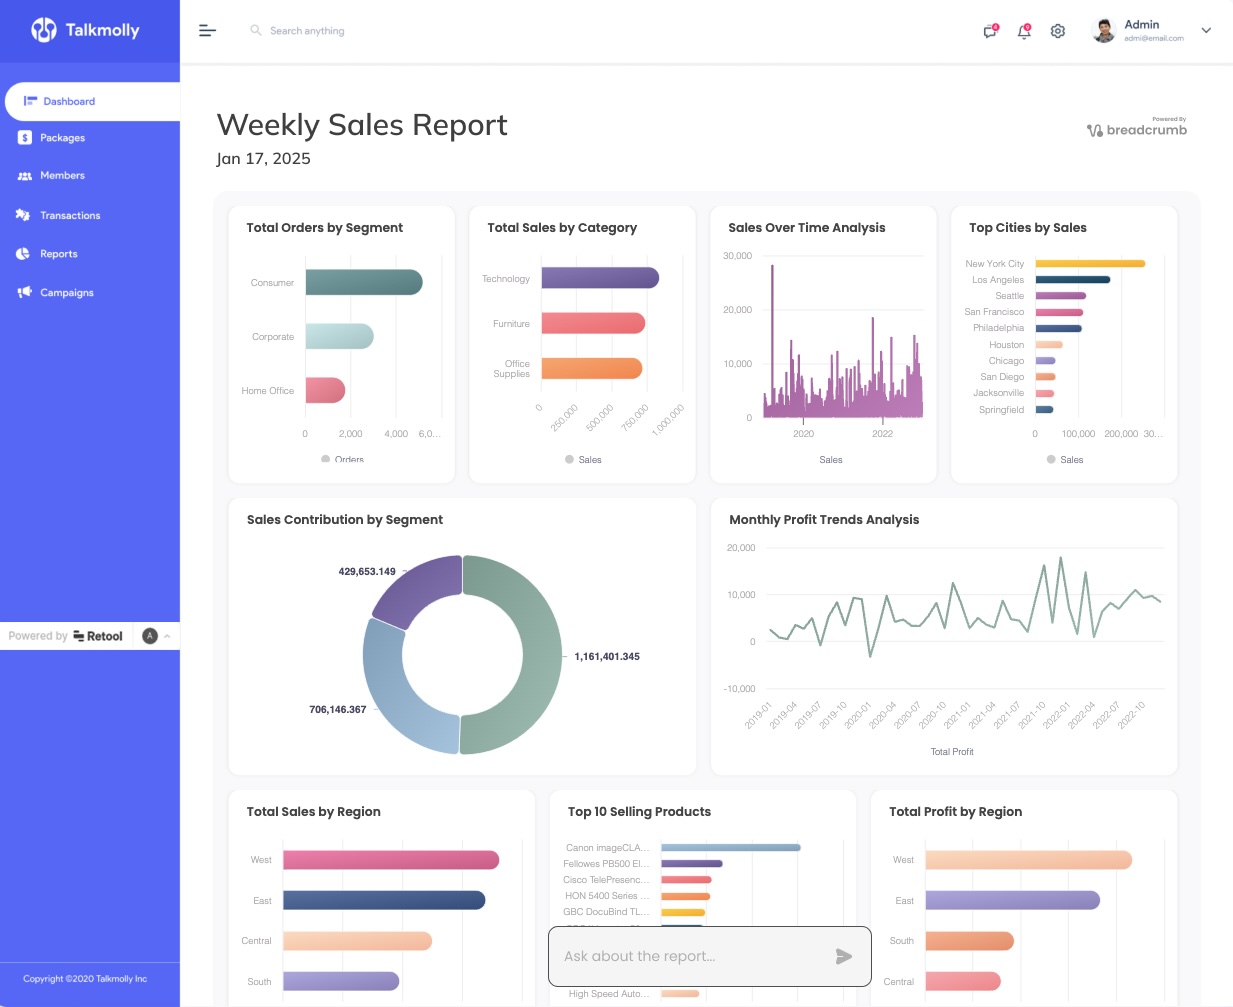
Learn how to create powerful analytics dashboards in Retool without writing any code or SQL. Build and embed dynamic data visualizations in minutes using generative AI.

Power BI dashboards often lead to slow updates and limited flexibility. AI-powered reporting allows customers to ask questions, generate custom visuals, and uncover insights instantly — without developer support.

Building truly self-service data products means removing dependencies on data experts by designing intuitive, automated systems.

Transform how consultants and agencies deliver insights with Breadcrumb’s AI-powered report generator, featuring interactive reports, dynamic data visualizations, and automated workflows.

Easily turn complex data into actionable insights with Breadcrumb.ai’s AI-powered visualizations. Discover five ways to create powerful dashboards to tackle key business challenges effortlessly.

Optimize your operations with Breadcrumb. Simplify data integration, ensure data quality, and gain actionable insights effortlessly with our AI-powered dashboard.

Join forces with the dynamic duo of web development – Tailwind CSS and astro.js. They're like Batman and Robin, but for your coding adventures. No capes required