
Manage data sources in a cleaner modal, expand tables to full screen, and define custom semantics right at the source for faster, more accurate insights.
Manage data sources in a cleaner modal, expand tables to full screen, and define custom semantics right at the source for faster, more accurate insights.
New group improvements help users see the current group, jump with auto pan, reorder groups, and send insights to the right place.
New: AI-powered data tables with full control, customizable KPI charts with change rates (beta), simpler tag-based group rules, and a synthetic data source generator—plus reliability and UX improvements.
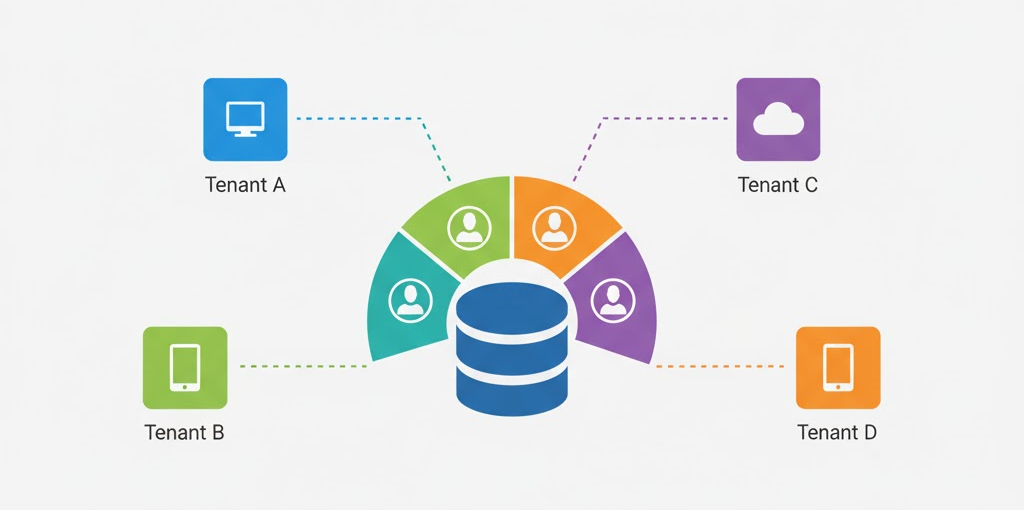
Learn how to design secure and scalable multi-tenant databases for AI-powered analytics and reporting. Explore segmentation strategies, tenant isolation, and row-level security.
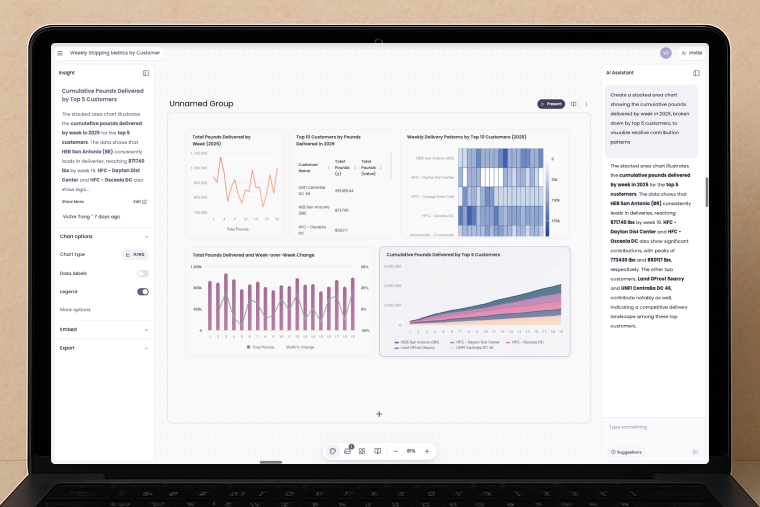
Discover the latest Breadcrumb features including custom instructions, resizable insight groups, batch widget generation, axis editing, and independent panels for a more powerful analytics experience.
Breadcrumb's redesigned dashboard brings chart controls, space management, restore checkpoints, and enhanced AI transparency—all designed to help you get insights faster with better visibility into your data analysis.
Breadcrumb now supports multiple organizations, shared workspaces, team permissions, and centralized data sources—making it easier than ever to collaborate on data and reports across teams and clients.
Meet our enhanced AI agent that helps you create smarter reports through natural conversations. Get instant guidance, recommendations, and insights with our more intuitive and responsive AI assistant.
Connect directly to more data sources and create better reports with our latest updates. From PostgreSQL to Google Analytics, access all your data in one place with improved KPI widgets and auto-layout features.
Discover new features that give you more control over your analytics: group-level AI rules, widget cloning, and SQL transparency. Create consistent, branded reports faster than ever.
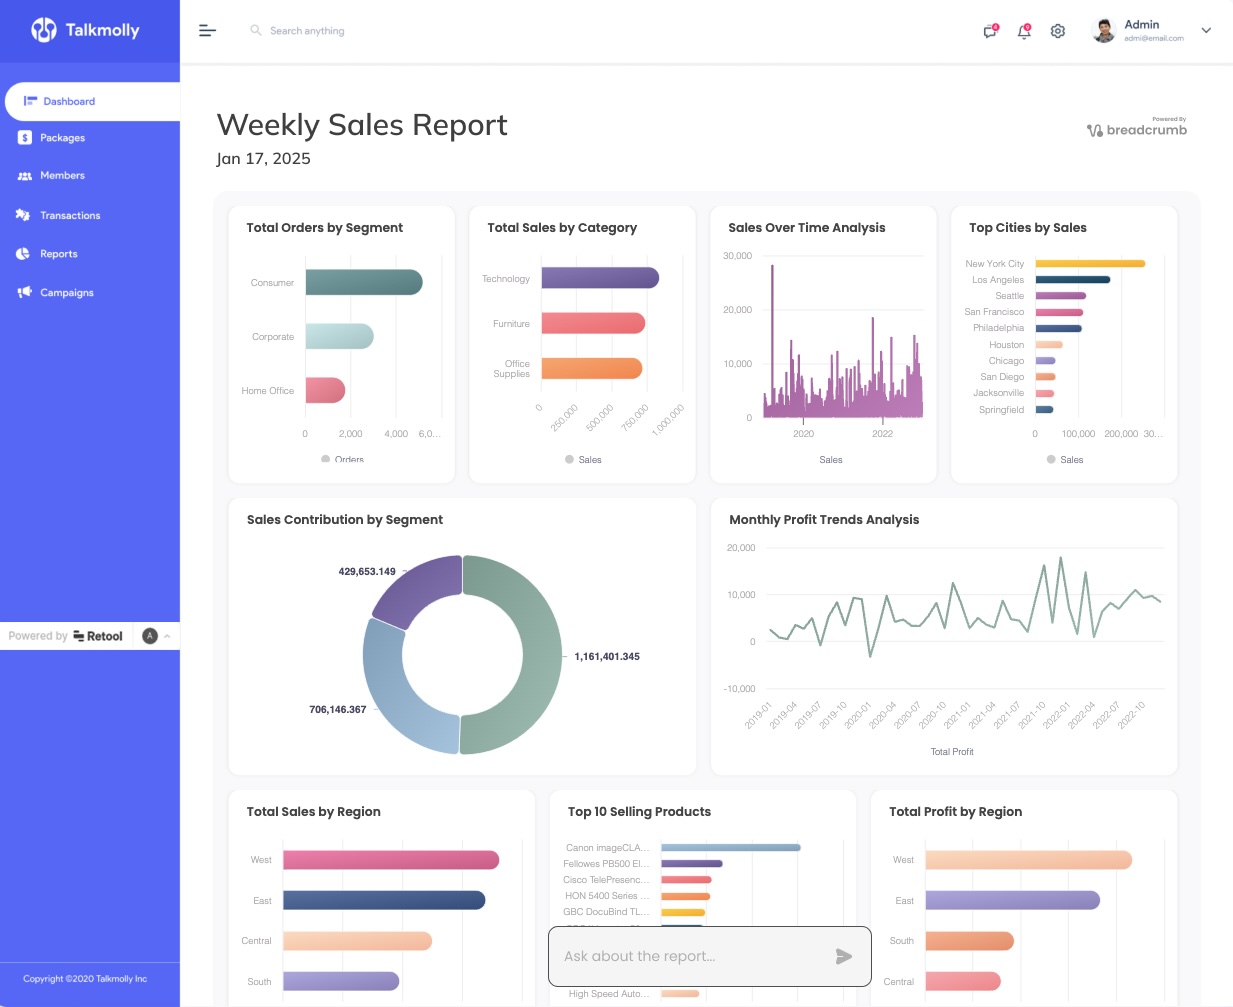
Learn how to create powerful analytics dashboards in Retool without writing any code or SQL. Build and embed dynamic data visualizations in minutes using generative AI.

Power BI dashboards often lead to slow updates and limited flexibility. AI-powered reporting allows customers to ask questions, generate custom visuals, and uncover insights instantly — without developer support.

The first wave of the internet disrupted media by shifting competitive advantage from distribution to media. Now, thanks to GenAI, a similar phenomena is happening in the world of analytics.
Breadcrumb Groups, a powerful new feature that allows you to organize multiple dashboards in one workspace for seamless data analysis.

Make Google do a double-take with Tailwind CSS's SEO magic. It's like giving your website a makeover that even the search engines can't resist. Astro.js is the wingman for this enchanting journey.

In today’s data-driven landscape, AI-powered dashboards simplify the process of turning large datasets into actionable insights. This post compares five leading AI data dashboards, including our own, Breadcrumb.ai, to help you choose the right tool for your needs.

Streamline your workflow with Breadcrumb’s new sharing and collaboration features. Connect to multiple data sources, including Airtable, for dynamic, instantly shareable visualizations.

For the last decade data tools have been built for data people - making everyone else reliant on them to...