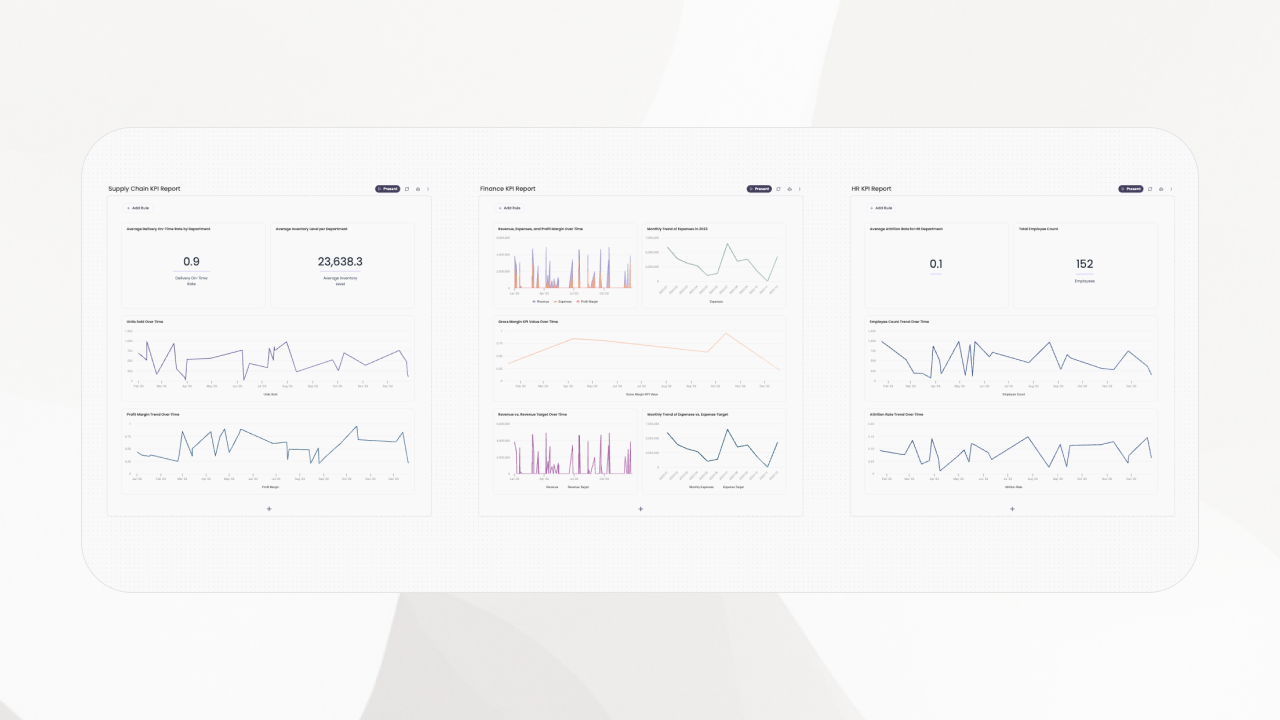
I share how I use KPI reporting to guide decisions, with uses, pros and cons, AI impact, dashboards versus reports, a creation framework, and templates.
I share how I use KPI reporting to guide decisions, with uses, pros and cons, AI impact, dashboards versus reports, a creation framework, and templates.
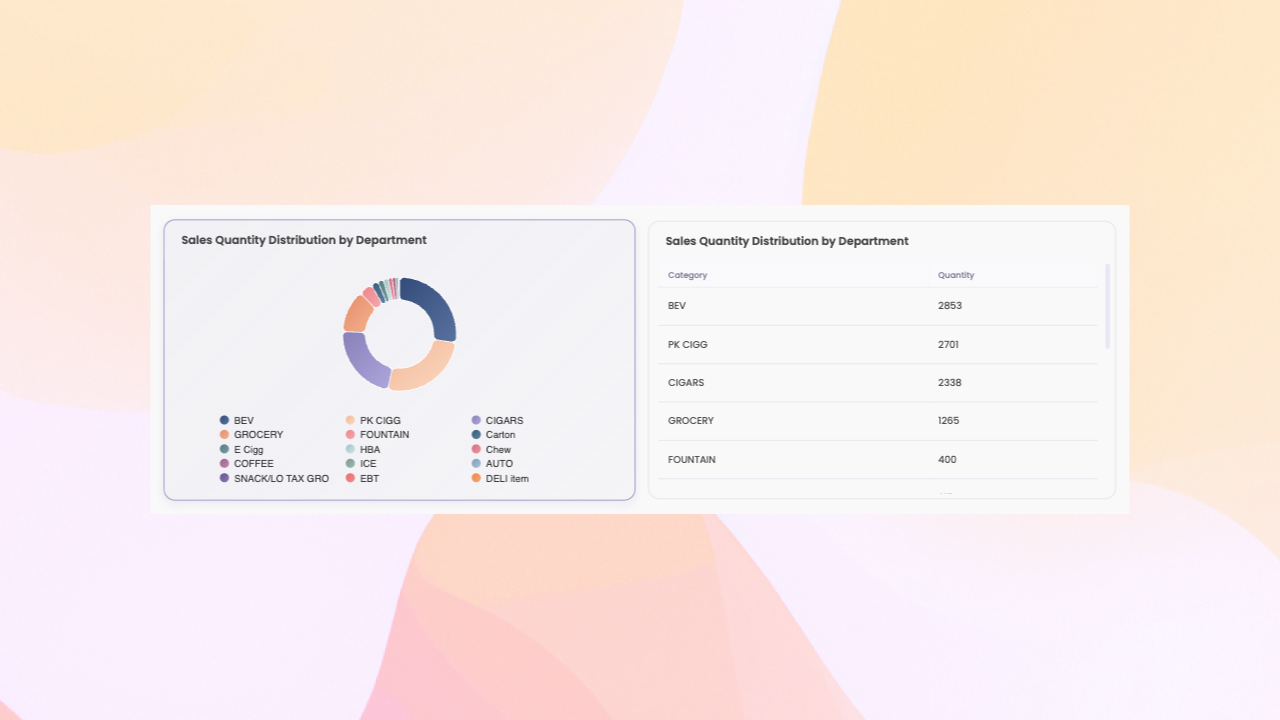
How I use pivot tables for exploration and pivot charts for communication—when to choose each and how they work together.
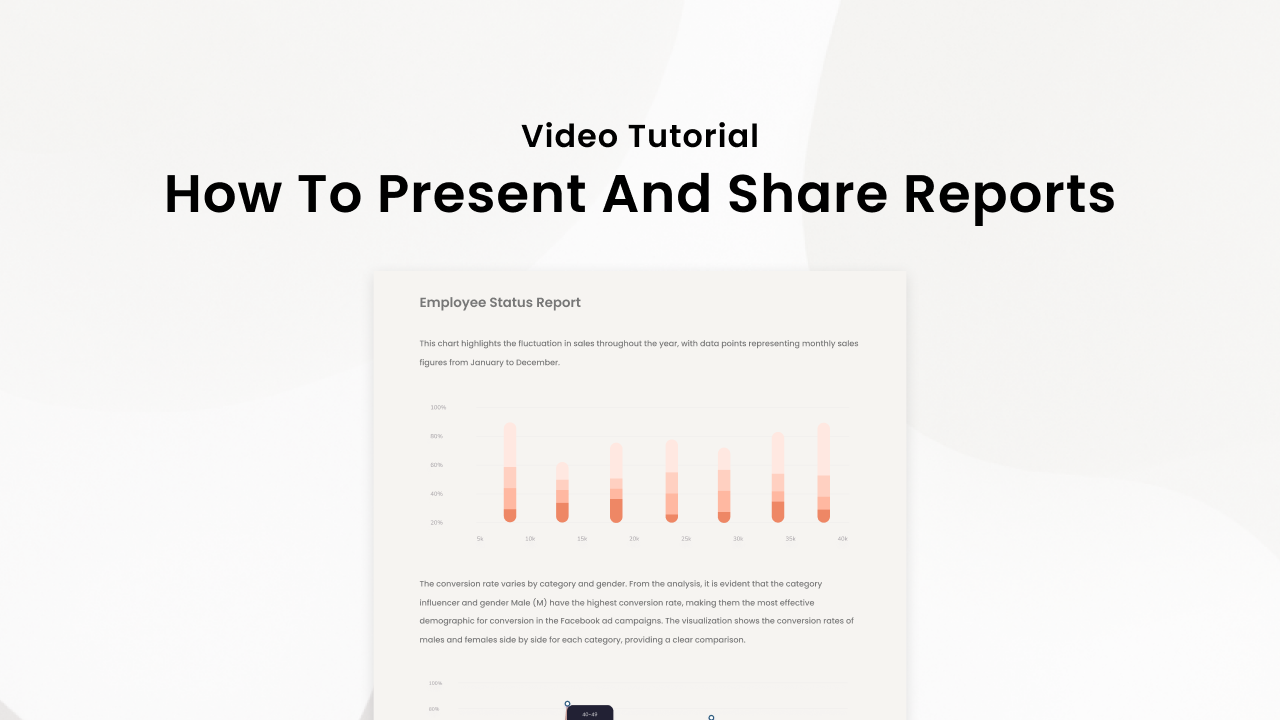
Learn how to transform your data insights into compelling, interactive stories with Breadcrumb's presentation and sharing features. Master the art of report storytelling with our comprehensive tutorial.