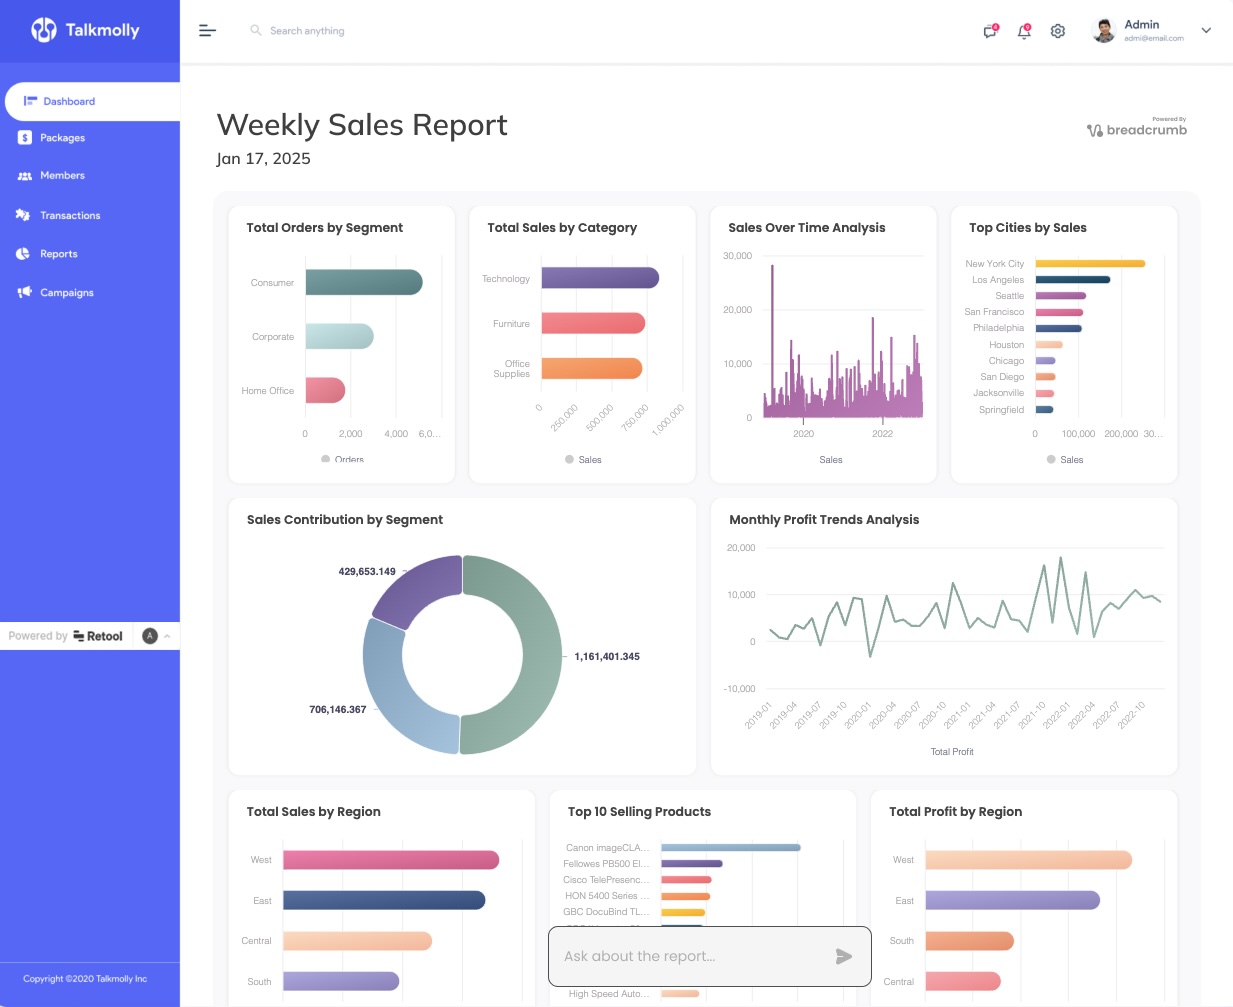
Summary
Breadcrumb.ai’s latest blog post, "How to Build AI-Powered Analytics Dashboards in Retool without SQL" (April 10, 2025), offers a step-by-step guide for creating dynamic analytics dashboards in Retool without writing any code or SQL. The article highlights how generative AI can be leveraged to embed interactive data visualizations in minutes, making advanced analytics accessible to non-technical users. This aligns with Breadcrumb’s mission to simplify data reporting and empower users to deliver actionable insights effortlessly—no spreadsheets or technical hurdles required. The post is authored by the Breadcrumb team, known for their educational, plain-English approach to analytics. Readers are encouraged to explore more use cases and resources on the Breadcrumb blog.
- What is the main takeaway from the latest Breadcrumb blog post about Retool? * You can build and embed AI-powered analytics dashboards in Retool without writing any code or SQL, using generative AI for fast, interactive data visualizations. (Source)
- Who is the intended audience for this guide? * Non-technical users, agencies, and teams looking to create powerful analytics dashboards quickly and without technical barriers.
- What makes Breadcrumb’s approach to analytics different? * Breadcrumb empowers users to “skip the spreadsheets” and ask questions in plain English, with AI handling the data work and visualization—no BI tool expertise required.
- How quickly can you create dashboards using this method? * The guide demonstrates that dynamic dashboards can be built and embedded in minutes, thanks to AI automation.
- Where can I find more resources or get started? * Visit the Breadcrumb blog for more guides, or sign up for access at breadcrumb.ai.
“Let your customers explore insights without learning BI tools.” — Breadcrumb Team
Ready to build smarter dashboards? Get access to Breadcrumb.ai and start delivering data stories that win clients.