Learn how to create powerful analytics dashboards in Retool without writing any code or SQL. Build and embed dynamic data visualizations in minutes using generative AI.
Learn how to create powerful analytics dashboards in Retool without writing any code or SQL. Build and embed dynamic data visualizations in minutes using generative AI.

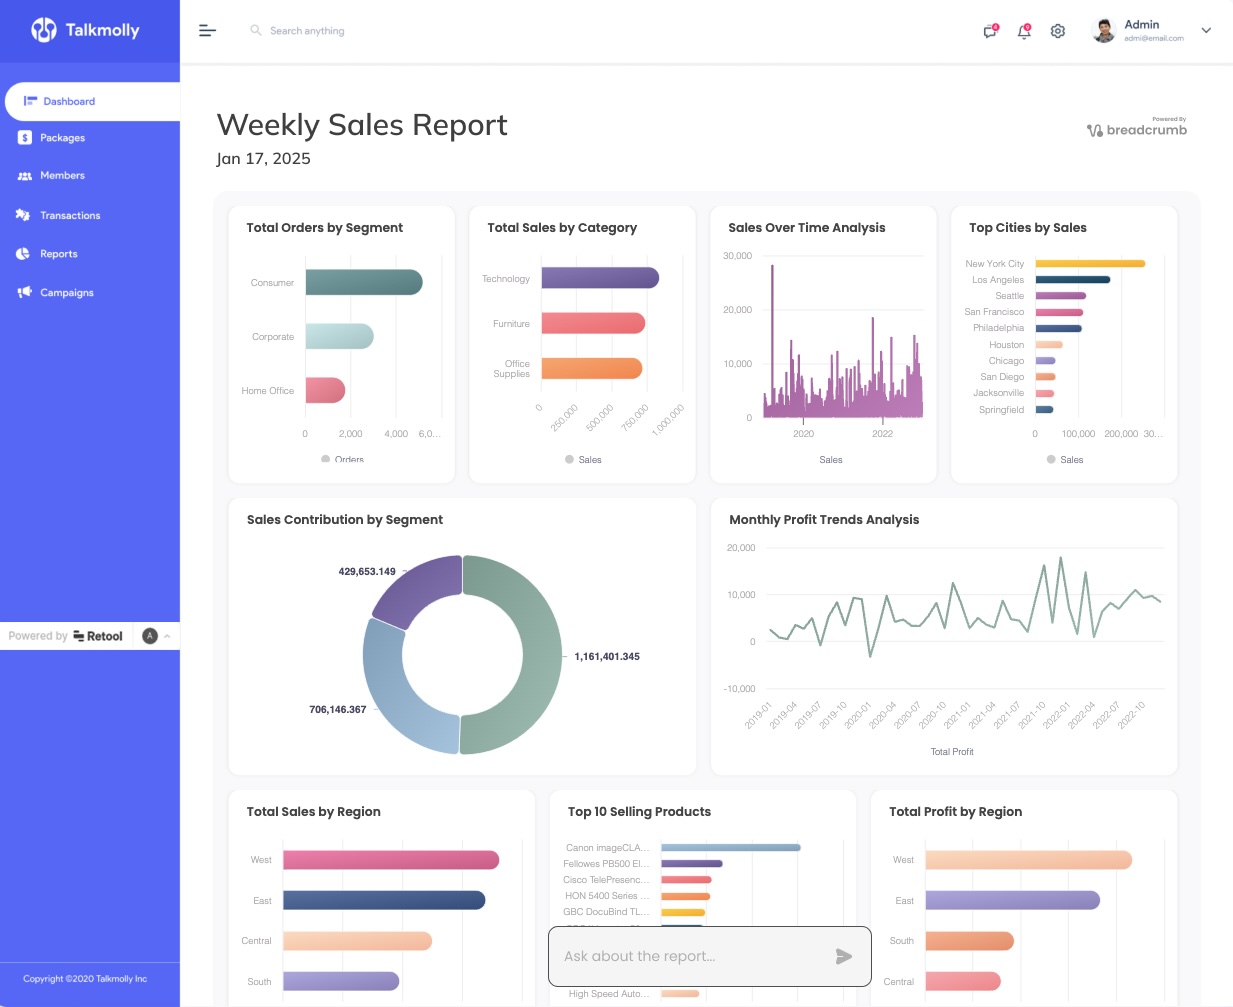
Power BI dashboards often lead to slow updates and limited flexibility. AI-powered reporting allows customers to ask questions, generate custom visuals, and uncover insights instantly — without developer support.